Airbnb Host Income & Expense Tracker
One workbook for up to ten short-term rentals. Paste in your Airbnb payouts, log costs as they happen, and read occupancy, average nightly rate and per-property profit off the dashboard.
It works in any country and in any currency. The currency is a dropdown of eleven codes on the Setup tab, or your own symbol typed in. One layer is US-specific: the expense categories arrive carrying Schedule E Part I line numbers. Those are plain text. Rename them on Setup to the expense boxes on your own return and every dropdown, total and chart follows.
€8one-time · no subscription · not on sale yet
What it does
Two registers, a dashboard and a page you can send your accountant. Nothing to maintain beyond typing the numbers in.
Short-term rental bookkeeping fails for a boring reason. The payouts live in Airbnb, the costs live in your bank account and your inbox, and nothing puts them in the same place until March, when you try to rebuild a year from memory.
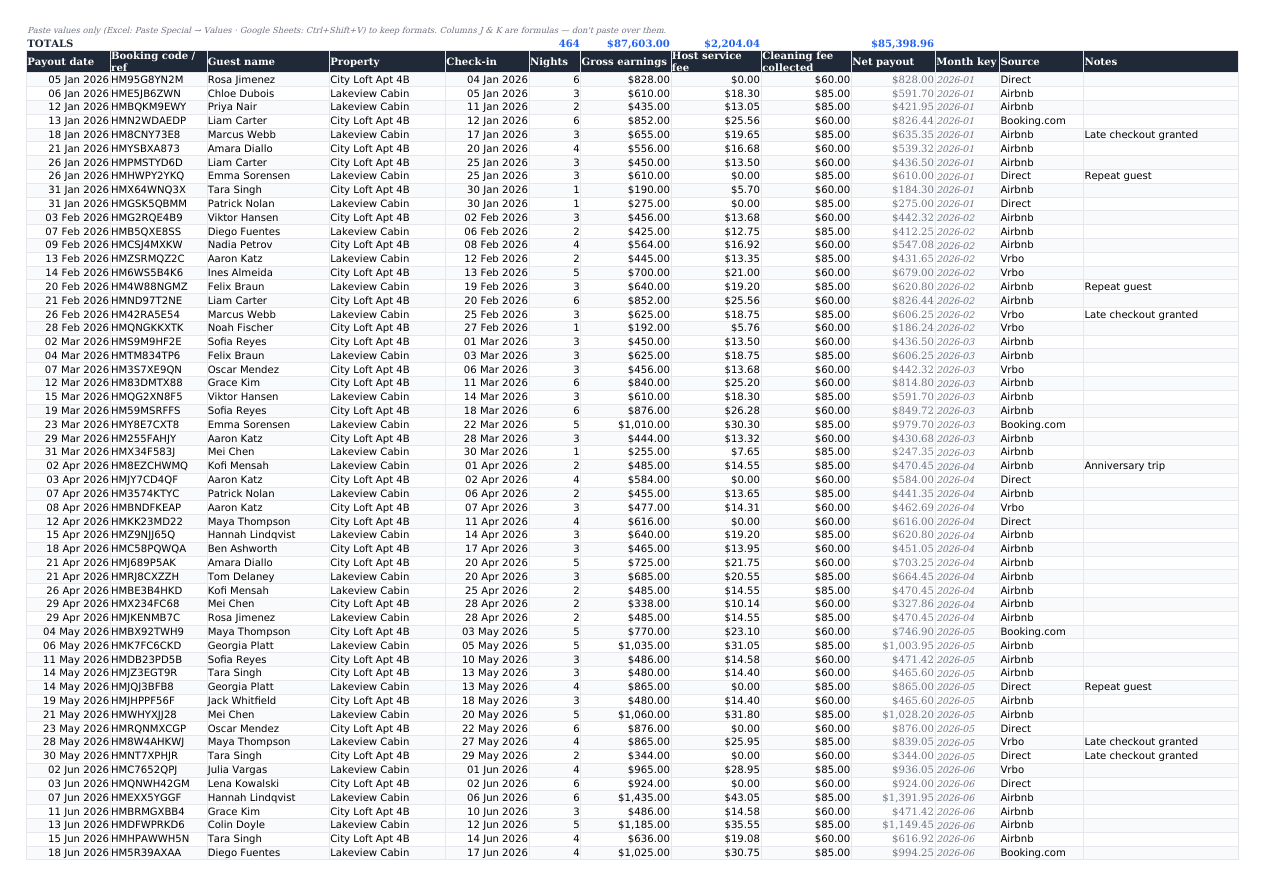
This is the same place. The Bookings tab is laid out column-for-column against Airbnb’s Transaction History CSV, so a year of payouts is a paste rather than an evening of retyping; the Instructions tab has the paste map. The Expenses tab is a plain cost register: pick a property and a category, and the category picks the tax line.
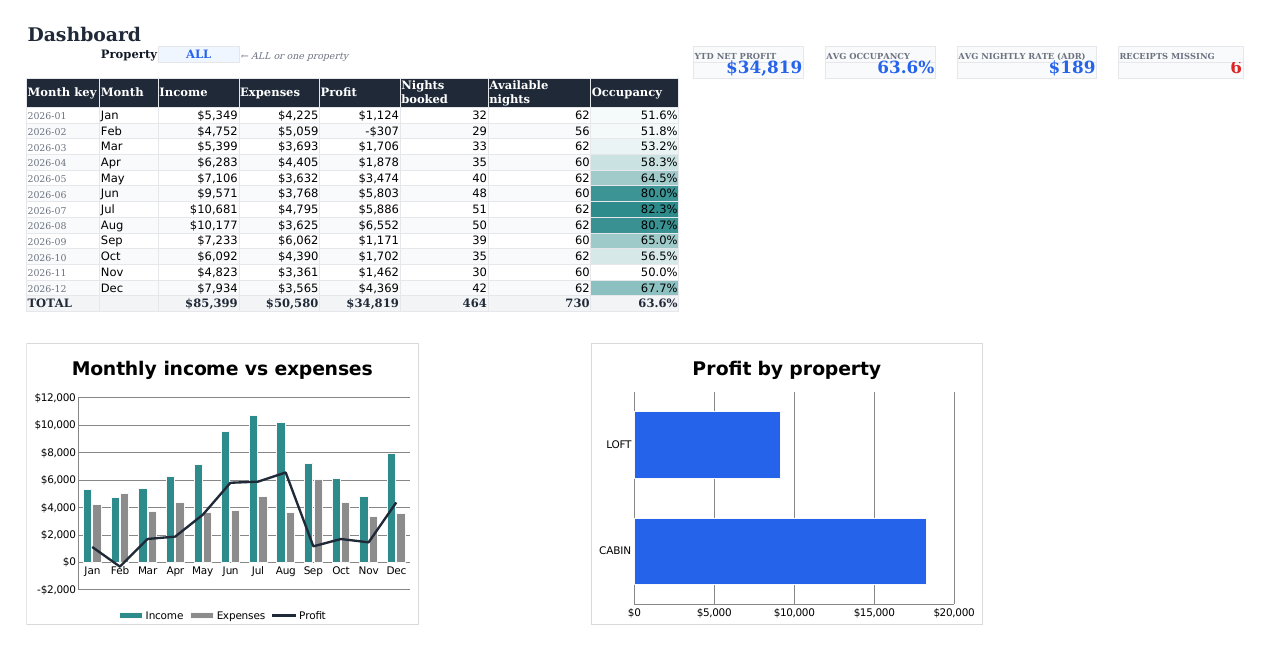
Everything else runs off those two tables. The Dashboard works out occupancy, average nightly rate and monthly profit. The Tax Summary totals each property by tax line, with the shared costs already split.
- Tracks 1-10 properties in one file, with an ALL view and a per-property filter
- Booking log matched to Airbnb’s export; Vrbo, Booking.com and direct stays go in the same table
- Currency dropdown on the Setup tab: eleven codes, or type your own symbol. No cell has a currency baked in
- Expense categories labelled with their US Schedule E Part I line numbers (lines 5–19), renamed in one place on Setup for any other country. The same categories work as a Schedule C breakdown
- Shared costs (accountant, photography, software) split automatically across active properties
- Occupancy, ADR and net profit calculated, not typed
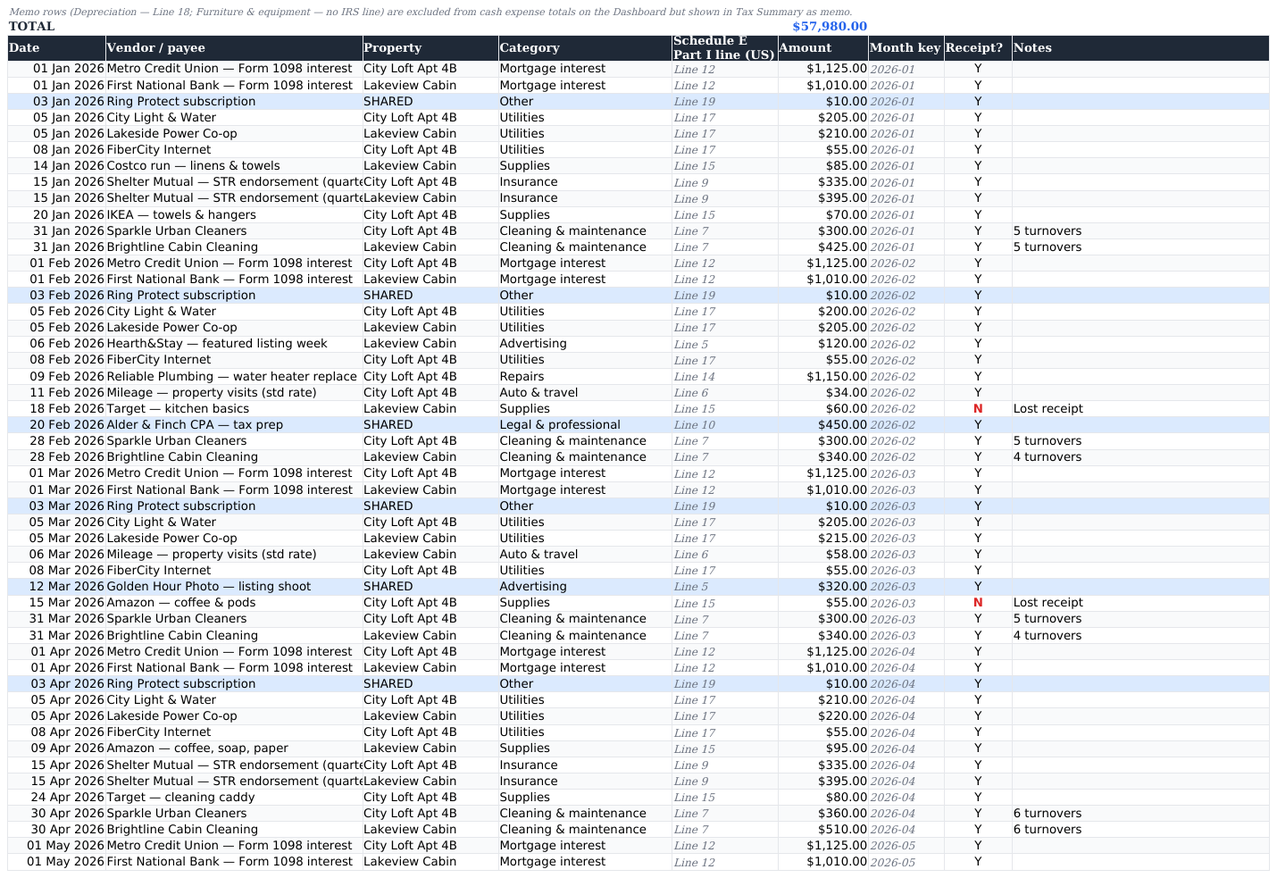
- Built-in warnings for duplicate booking codes, host-fee typos and missing receipts
- Ships with a full demo year so you can see it working before you clear it
Who it is for
A good fit if
- You host between one and ten listings and do your own books
- You want your accountant to get a clean per-property summary instead of a bank statement
- You would rather own a file than rent another SaaS seat
- You can type in a spreadsheet. That is the whole interface
- You host outside the US and just need consistent categories you can rename
Not a good fit if
- You want automatic bank or Airbnb syncing. This connects to nothing
- You need a channel manager, calendar or pricing tool; this tracks money only
- You run more than about ten properties, where a proper PMS earns its fee
- You want software that files your tax return. This organises figures; it computes no tax
- You need depreciation worked out for you; that stays a memo line for your accountant
What is inside, tab by tab
Six tabs. You type into two of them.
| Tab | What it holds | What it does for you |
|---|---|---|
| Instructions | Quick start, the Airbnb paste map, the shared-cost rules, how to clear the demo data, and notes on Google Sheets and LibreOffice. | Answers the things you would otherwise email us about, down to the menu path to the Airbnb export. |
| Setup | Property names, short chart nicknames, active flag, tax year, and the category → tax-line table. | One cell sets the tax year and the Dashboard rebuilds its twelve months around it. Editing the category table changes every dropdown in the file. |
| Bookings | 500 rows: payout date, booking code, guest, property, check-in, nights, gross earnings, host service fee, cleaning fee, source, notes. | Net payout and month key calculate themselves. Duplicate booking codes and implausible host fees are highlighted as you paste. |
| Expenses | 500 rows: date, vendor, property (or SHARED), category, amount, receipt flag, notes. | Picking a category fills the tax line automatically. Memo-only rows such as depreciation are kept out of the cash totals but stay visible for tax. |
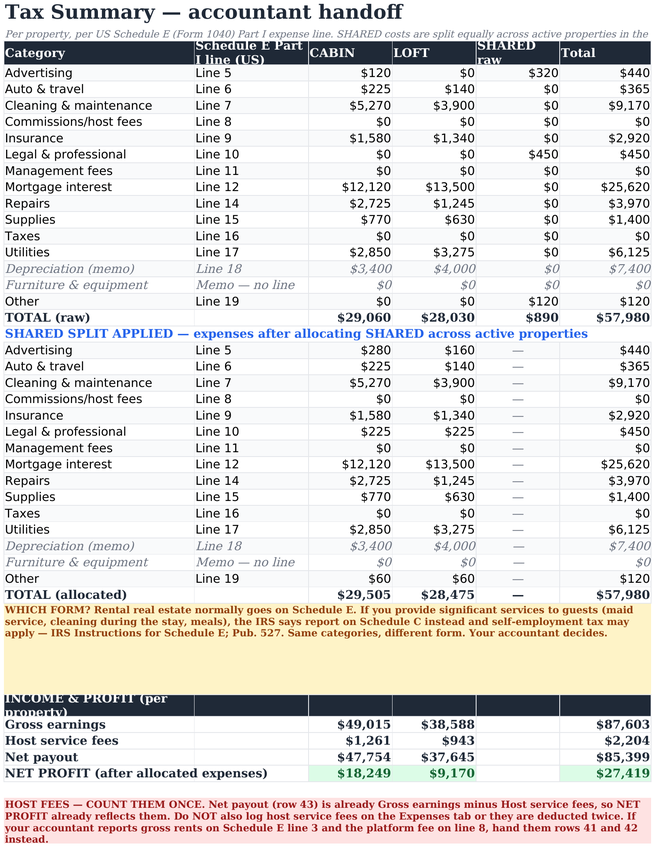
| Tax Summary | Per-property totals by tax line, raw first and then with shared costs allocated, plus gross earnings, host fees, net payout and net profit. | The page you send your accountant. It is an organised summary, not a completed Schedule E, and the raw figures stay beside the allocated ones so they can re-cut the split if they prefer another basis. |
| Dashboard | Month-by-month income, expenses, profit, nights booked, available nights and occupancy, plus two charts and four headline figures. | Year-to-date net profit, average occupancy, average nightly rate and a missing-receipts counter. Filter to one property or view them all. |
Shared costs, handled properly
Set a cost’s property to SHARED and the Tax Summary splits it equally across every property marked active on Setup. The unsplit total stays in its own column, so if your accountant would rather allocate by revenue or floor area, the raw figure is still sitting there.
What it looks like
The actual workbook with the demo year loaded. That data ships in the file, so none of this is a mock-up.
Specification
Honest notes before you buy
We have no reviews yet, so take the plain version.
- It is a spreadsheet. No app, no login, no sync. If you want something that connects to your Airbnb account, this is not it.
- It does not compute your tax and it is not a tax form. It sorts figures onto the lines an accountant expects. Depreciation stays a memo item on purpose: basis, bonus rules and recapture are too property-specific for a template to guess.
- It does not decide which form you file. Most rental real estate goes on Schedule E. But the IRS Instructions for Schedule E say that if you provide significant services to the renter, you report on Schedule C instead, and self-employment tax may apply (Pub. 527). Maid service is the example the IRS itself gives. Your accountant makes that call, not this file.
- Count host service fees once. Net payout is already gross earnings minus the platform fee, so logging the fee again on the Expenses tab would deduct it twice. The Tax Summary says so in red, next to the income block.
- The Schedule E labels are text. Outside the US they carry no legal meaning at all. Rename them on the Setup tab, in one place, and every dropdown and total follows; the arithmetic is identical everywhere. What we have not done is ship a per-country edition with your own box numbers already typed in, so that part is fifteen lines of typing you do once.
- The shared-cost split is equal, not weighted. A deliberate simplification. The unsplit figures stay visible so a different allocation is still possible.
- You will have to clear the demo data. It ships full so nothing looks broken on first open. Emptying it takes a minute, step by step, in the Instructions tab.
Questions
Schedule E or Schedule C: which one am I?
This workbook cannot answer that and does not try to. Most rental real estate is reported on Schedule E. But the IRS Instructions for Schedule E say that if you provide significant services to the renter, you report the activity on Schedule C instead, and self-employment tax may apply (IRS Publication 527). Maid service is the IRS’s own example. In the real world it usually means daily cleaning, linen changes or meals.
Short stays are a separate question and the two are often confused: the seven-days-or-less average-stay test lives in the passive activity loss rules and governs how losses are treated, not which form you file. A short average stay does not by itself put you on Schedule C.
The fifteen expense categories are useful on either form; only the line numbers are Schedule E specific. If you have not settled the question with an accountant, treat this as a bookkeeping tool rather than an answer.
Does it work in Google Sheets?
Yes. File → Import → Upload, then Replace spreadsheet. Formulas, dropdowns, the warning highlights and both charts survive it. LibreOffice Calc opens the file directly.
Do I have to retype my Airbnb bookings?
No. Download the Transaction History CSV from your host account and paste the columns into the Bookings tab; nine of them line up one to one, and the map is in the Instructions tab. Paste values only and leave the two formula columns alone. Vrbo, Booking.com and direct guests go in the same table with the source set accordingly.
I am not in the US. Is Schedule E useless to me?
The line labels are ordinary text on the Setup tab, with no legal meaning outside the US. Rename the fifteen categories to match your own return, whether that is the UK property pages or a German Anlage V, and every dropdown, total and summary follows. Cleaning, utilities, insurance, mortgage interest and management fees are the same costs everywhere.
How many properties can it handle?
Up to ten, all sharing one Bookings table and one Expenses table. Past ten the Tax Summary grid gets wide and a purpose-built system starts to earn its subscription.
Is 500 rows enough?
For most hosts, yes. 500 bookings and 500 expense rows cover a busy year across several properties. If you need more, copy the last row’s formulas down and extend the totals in row 2; the Instructions tab says which cells.
Does it calculate occupancy for me?
Yes. The Dashboard counts nights booked against available nights for the tax year you set, per month and for the year, and shows average nightly rate alongside it. You do not type either number.
Will it catch my mistakes?
Some of them. It flags duplicate booking codes, host service fees that look wrong against the gross figure, and expense rows with no receipt. It cannot tell you about a booking you never typed in.
What about depreciation?
It has a category and stays a memo line: in the Tax Summary for your accountant, out of the cash totals on the Dashboard so it does not distort your monthly profit. The figure itself comes from them, not from here.
Can I put it on more than one computer?
Yes. It is a file. Keep it wherever you keep your own files, on as many of your own devices as you like.
What if it does not suit me?
Email support@vendwright.com. Refund terms for digital downloads are set out on the refunds page.
Tax disclosure
Not tax advice. This workbook organises your numbers. It does not compute your tax, does not fill in any tax form, and does not decide which form you file.
Which form. Most rental real estate is reported on Schedule E. But the IRS Instructions for Schedule E state that if you provide significant services to the renter (maid service is the IRS’s own example), you report the activity on Schedule C instead, and self-employment tax may apply (Pub. 527). Your accountant makes that call.
Average stay length is a separate question and must not be conflated with it: the seven-days-or-less test (Treas. Reg. §1.469-1T(e)(3)(ii)(A)) governs passive-activity loss treatment, not which form you file.
Line numbers. The labels shown are the expense lines printed on IRS Schedule E (Form 1040), Part I, lines 5–19, checked against the 2025 form and the IRS early-release draft 2026 form. The IRS can renumber a form in any year, so check the current-year form before filing.
The Tax Summary is a handoff, not a return. It is an organised summary for your accountant, not a completed or IRS-approved Schedule E. The income block (gross earnings, host service fees, net payout) is deliberately not line-mapped; reconciling it to your 1099-K and to Schedule E line 3 is your accountant’s job. Count host service fees once. Net payout is already net of them, so do not also log them as an expense.
Depreciation is deliberately a memo item. Basis, bonus rules and recapture are too property-specific for any template to guess.
Outside the US the “Schedule E line” labels are plain text with no legal meaning. Rename them to your own country’s expense boxes.
Not affiliated with, endorsed by or sponsored by the IRS, Airbnb, Vrbo or Booking.com.
Airbnb Host Income & Expense Tracker
Up to ten properties, US Schedule E expense categories, Excel or Google Sheets or LibreOffice. €8 once, no subscription.
Not sure the numbers work yet? The free calculator gives you the occupancy you need to cover your costs, before you spend anything here.